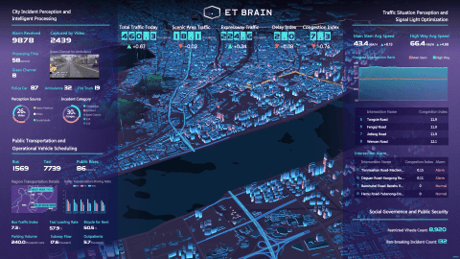
With our data visualisation tool, DATA V, you may examine and display vast and intricate data indexes as visual dashboards. Through an intuitive graphical interface, DATA V seeks to make data visualisation more accessible to a wider audience and assist engineers in building effective visual applications.
In the circumstances like conferences and presentations, business monitoring, risk warning, and geographic data analysis, DATA V can meet your requirements for data visualisation. This data-driven process enables effective data mining and analysis, allowing the client to reap many benefits.
DATA V provides many primary and third–party chart libraries to help users create excellent infographics.
With DATA V, you can overlay geographic data and produce effects like heat maps, regional chunks, flying lines, geographic trajectories, and 3D globes.
To better serve your organisation, DATA V offers a wide variety of industry-specific data templates.
DATA V requires little programming knowledge and allows you to develop expert visualisation projects with straightforward drag-and-drop operations.
Projects for DATA V visualisation can be modified and divided into a variety of unusual arrangements. You can establish access control and secure the information displayed on the dashboards by publishing projects with a password or token authentication.
Use dynamic requests to connect to databases such as OracleDB, ApsaraDB for RDS, and APIs. The CSV and JSON formats for static data are also supported by DATA V.
A quick and effective way to set up component interactions, enabling interactive data analysis by transferring parameters from one component to another.


Copyright © 2020 Skillmine Saudi Arabia for Communication and Information Technology. All Rights Reserved
حقوق النشر © 2020 شركة سكيلمين العربية السعودية للاتصالات وتقنية المعلومات جميع الحقوق محفوظة